Cory:
Unlock Your AI Assistant Now!
Abstract
Background: Evidence regarding the long-term outcomes and durability of balloon-expandable transcatheter heart valves (BE-THVs) after transcatheter aortic valve implantation (TAVI) is still scarce.
Aims: This study evaluates these outcomes and further examines their association with the annular size in patients.
Methods: A total of 2,699 patients who had undergone TAVI with a BE-THV at least 5 years prior to our study were analysed. A small aortic annulus (SAA) was defined as an area ≤430 mm2; any larger annuli were labelled large aortic annuli (LAA). The primary endpoints were the incidence of all-cause mortality and bioprosthetic valve failure (BVF) between the SAA and LAA groups. As a subanalysis, the primary endpoints were examined in relation to postprocedural mean pressure gradient (mPG) ≥20 mmHg, severe prosthesis-patient mismatch (PPM), and sex differences, comparing SAA and LAA each time.
Results: Overall, 66.4% (n=1,793) of patients were categorised into the SAA group. At 7 years after TAVI, the cumulative all-cause mortality showed differences between the SAA and LAA groups (55.2% vs 58.6%), while BVF assessed by Gray’s test was similar between the groups (3.3% vs 2.7%). The Cox multivariable analysis revealed no association between SAA and worse prognosis (hazard ratio 1.07, 95% confidence interval: 0.85-1.36; p=0.56). There were no significant differences in mortality or BVF regarding an mPG ≥20 mmHg, severe PPM, or sex between the SAA and LAA groups (allp>0.05).
Conclusions: Annular size differences were not found to influence long-term outcomes or valve durability following TAVI with a BE-THV, suggesting that other factors warrant further investigation.
The indications for transcatheter aortic valve implantation (TAVI) in aortic stenosis (AS) patients have been expanded with growing clinical evidence12. One of the key issues is the clinical demand for long-term durability data on transcatheter heart valves (THVs) to support TAVI expansion into a broader patient population. However, the data on this matter are limited and insufficient to draw definitive conclusions. Recent clinical concerns have also emerged regarding the impact of THV design on haemodynamic parameters assessed by postprocedural echocardiography and their association with long-term prognosis. Many studies indicate that balloon-expandable (BE)-THVs result in higher mean pressure gradients (mPG) and a greater incidence of prosthesis-patient mismatch (PPM) compared to self-expanding (SE)-THVs, especially in patients with a small aortic annulus (SAA)34. This trend has also been validated by previous reports in Asian patients with smaller body sizes56. Several of these parameters are featured in a recent pivotal randomised controlled trial (RCT) and the Valve Academic Research Consortium (VARC)-3 criteria as critical indicators for assessing valve function37. In contrast, another pivotal RCT using BE-THVs has demonstrated that long-term clinical outcomes do not differ significantly by annular size, suggesting that smaller annuli do not necessarily confer a worse prognosis8. Investigating the long-term outcomes and valve durability of patients with an SAA receiving a BE-THV is essential to explore the clinical significance and potential generalisability of the echocardiographic parameters observed in this subset of patients. Therefore, this study utilises a large cohort of 2,699 patients to examine whether long-term outcomes up to 7 years after TAVI differ based on variations in the baseline aortic annular size. Furthermore, the bioprosthetic valve failure (BVF) criteria defined by VARC-3 were adopted to accurately assess the relationship between annular size differences and THV durability.
Methods
Study population
The data used in this study were extracted from the pooled Optimized transCathEter vAlvular interventioN-Transcatheter Aortic Valve Implantation (OCEAN-TAVI) registry database910. This study was registered with the University Hospital Medical Information Network Clinical Trials Registry (UMIN000020423) and received approval from the International Committee of Medical Journal Editors. The study protocol was created in alignment with the Declaration of Helsinki and approved by the ethics committees of all participating hospitals. Informed consent was obtained from all patients before their enrolment in the study. The study was conducted with a cohort of 2,756 patients who were scheduled to undergo treatment with a BE-THV of the SAPIEN 3 series (Edwards Lifesciences) between May 2016 and September 2019, with the expectation of a minimum follow-up of 5 years. Consistent with previous investigations34, the definition of an SAA was a cutoff annulus size equal to or less than 430 mm2 assessed by preprocedural multidetector computed tomography (CT). The exclusion criteria of this study were the following: (1) patients without CT examinations or missing information from CT findings were initially excluded (n=42), (2) THV delivery failure during TAVI (n=2), (3) patients who were discharged alive but required a surgical valve replacement due to procedural complications (n=5), and (4) patients who were discharged alive but had a second THV implantation during an index TAVI procedure (n=8). The remaining 2,699 patients constituted the study population, which was then divided into the SAA (≤430 mm2) and large annulus area (LAA; >430 mm2) groups according to the annular size. The study flowchart is shown in Supplementary Figure 1.
Device description
The valve sizes of the BE-THVs were 20, 23, 26, and 29 mm. Device size was determined at each institution using standard sizing charts, with a general recommendation to avoid oversizing by more than 20%. Predilatation, post-dilatation, and the approach route were determined by each institution’s Heart Team, with approaches limited to transfemoral, transapical, or direct aortic access during this period, as subclavian access was not approved.
Data definition and study endpoints
The OCEAN-TAVI database includes baseline patient characteristics, laboratory data, transthoracic echocardiography (TTE) findings, and CT parameters. The severity of aortic stenosis was determined by the aortic valve area (AVA), indexed AVA, peak aortic valve velocity, or mPG. All procedural complications, including vascular complications, bleeding, stroke, acute kidney injury, and newly required pacemaker implantation (PMI) were evaluated. The postprocedural TTE was performed during the index hospital stay before discharge. All procedure-related variables, complications, echocardiographic findings − including paravalvular leakage (PVL) and PPM − and BVF were defined using VARC-3 criteria7. The postprocedural degree of PVL was classified as none-trace, mild, moderate, or severe. The existence of severe PPM was classified as an indexed effective orifice area (EOA) ≤0.65 cm2 in patients with a body mass index (BMI) <30 kg/m2, whereas severe PPM was defined as an indexed EOA ≤0.55 cm2 in patients with a BMI ≥30 kg/m2. BVF is defined as the fulfilment of one of the following three criteria: Stage 1 involves any bioprosthetic valve dysfunction associated with clinically expressive criteria. This can include new-onset or worsening symptoms; left ventricular dilation, hypertrophy, or dysfunction; or the presence of pulmonary hypertension. Additionally, Stage 1 includes irreversible Stage 3 haemodynamic valve deterioration (HVD). Stage 3 HVD is characterised by a significant increase in the mean transvalvular gradient of 20 mmHg or more, resulting in a mean gradient of 30 mmHg or higher, accompanied by a reduction in EOA to 0.6 cm² or less, or a decrease of 50% or more. Alternatively, there may be a decrease in the Doppler velocity index of 0.2 or more, or a decrease of 40% or more, compared with an echocardiographic assessment conducted 1-3 months post-procedure. Another indicator of Stage 1 is the new occurrence or an increase of two or more grades of intraprosthetic aortic regurgitation (AR), resulting in severe AR. Stage 2 is defined by the need for an aortic valve intervention, typically indicating that surgical or other transcatheter aortic valve (TAV)-in-TAV interventions are necessary to address the valve dysfunction. Stage 3 is characterised by valve-related death, or death that is presumed to be directly related to bioprosthetic valve dysfunction, signifying the most severe form of failure. Patients who have died as a result of prosthetic valve endocarditis (PVE) are also classified under Stage 3 BVF. The primary endpoints were the incidence of all-cause mortality and BVF in the overall cohort and within the SAA or LAA groups. A subanalysis investigated the prognosis and frequency of BVF in patients with and without a postprocedural mPG ≥20 mmHg and severe PPM. Additionally, sex differences were analysed by comparing SAA and LAA outcomes between males and females. Heart failure (HF) rehospitalisation was also evaluated as a secondary outcome.
Statistical analysis
Continuous variables are expressed as mean±standard deviation and median with interquartile range. Categorical data were compared between the groups using chi-square tests. Differences in non-categorical data were tested using the unpaired Student’s t-test or Mann-Whitney U test, depending on the variable distribution. For the primary outcome, the Kaplan-Meier method was used to estimate the cumulative incidence of all-cause mortality. An exposure-adjusted event rate of BVF was estimated by dividing the number of events reported by the total follow-up time of the study population and reported using a patient-year unit (per 1,000 patient-years), based on the recommendation of the VARC-3 criteria7. The cumulative incidence function was used to estimate the incidence of BVF, accounting for competing risk, with death without BVF treated as a competing event. The Fine and Gray model was developed to analyse the association with the risk of BVF events while appropriately addressing competing risks. To detect the predictors of the primary endpoint of all-cause mortality, clinical variables in the univariable analysis (p<0.05) were included in a multivariable Cox regression analysis. A subsequent multivariable model that included all significant variables and hazard ratios (HRs) was constructed, and the 95% confidence intervals (CIs) were estimated. The interaction between annular size and the primary endpoint was evaluated using a forest plot. This analysis examined whether the incidence of the primary endpoint differed between the SAA and LAA groups depending on baseline characteristics such as patient demographics, postprocedural mPG, and the presence of severe PPM. All statistical analyses were performed using SPSS software, version 22 (IBM). Differences were considered statistically significant at a p-value<0.05, and 95% CIs are reported as appropriate.
Results
Baseline characteristics
The baseline patient characteristics are presented in Table 1. In the overall cohort, the average age was 84.4 years old, and 33.4% were male. There were numerous differences in the clinical and echocardiographic variables between the groups. The proportion of males was lower in the SAA group, whereas it was higher in the LAA group (15.4% vs 68.9%; p<0.001). Patients in the SAA group had smaller body sizes, resulting in lower creatinine levels, although there was no significant difference in the estimated glomerular filtration rate. In the SAA group, increased peak flow velocity and mPG on echocardiography were observed, and stroke volume was lower. Procedurally, predilatation was more frequently performed in the LAA group.
Table 1. Baseline characteristics between the SAA and LAA groups.
| Overall (n=2,699) |
SAA (n=1,793) |
LAA (n=906) |
p-value | |
|---|---|---|---|---|
| Clinical variables | ||||
| Age, years | 84.36±5.25 | 84.78±5.10 | 83.54±5.45 | <0.001 |
| Male | 901 (33.4) | 277 (15.4) | 624 (68.9) | <0.001 |
| Height, cm | 151.05±9.31 | 147.92±7.81 | 157.24±8.95 | <0.001 |
| Body weight, kg | 51.15±10.56 | 48.75±9.70 | 55.89±10.61 | <0.001 |
| BMI, kg/m2 | 22.34±3.73 | 22.23±3.80 | 22.56±3.58 | 0.030 |
| BSA, m2 | 1.45±0.17 | 1.40±0.15 | 1.55±0.17 | <0.001 |
| Hypertension | 2,278 (84.4) | 1,537 (85.7) | 741 (81.8) | 0.009 |
| Diabetes | 806 (29.9) | 507 (28.3) | 299 (33.0) | 0.013 |
| Coronary artery disease | 957 (35.5) | 582 (32.5) | 375 (41.4) | <0.001 |
| Peripheral artery disease | 277 (10.3) | 186 (10.4) | 91 (10.0) | 0.846 |
| Atrial fibrillation | 622 (23.0) | 362 (20.2) | 260 (28.7) | <0.001 |
| Previous stroke | 313 (11.6) | 202 (11.3) | 111 (12.3) | 0.492 |
| NYHA III/IV | 986 (36.5) | 647 (36.1) | 339 (37.4) | 0.524 |
| Chronic kidney disease | 1,890 (70.0) | 1,255 (70.0) | 635 (70.1) | 0.995 |
| Haemodialysis | 3 (0.1) | 1 (0.1) | 2 (0.2) | 0.262 |
| COPD | 223 (8.3) | 112 (6.2) | 111 (12.3) | <0.001 |
| Previous CABG | 110 (4.1) | 63 (3.5) | 47 (5.2) | 0.297 |
| Blood examinations | ||||
| Creatinine, mg/dL | 1.02±0.58 | 0.97±0.58 | 1.11±0.57 | <0.001 |
| eGFR, mL/min/1.73 m2 | 51.53±18.34 | 51.33±18.23 | 51.94±18.56 | 0.417 |
| Echocardiographic variables | ||||
| AVA, cm2 | 0.64±0.18 | 0.62±0.17 | 0.68±0.19 | <0.001 |
| Indexed AVA, cm2/m2 | 0.44±0.12 | 0.45±0.12 | 0.44±0.12 | 0.410 |
| Peak flow velocity, m/sec | 4.44±0.78 | 4.50±0.76 | 4.32±0.78 | <0.001 |
| Peak PG, mmHg | 81.28±28.00 | 83.45±28.18 | 77.00±27.14 | <0.001 |
| mPG, mmHg | 47.30±17.42 | 48.52±17.63 | 44.89±16.77 | <0.001 |
| LVEF, % | 60.15±12.31 | 62.16±11.43 | 56.17±12.99 | <0.001 |
| Stroke volume, mL | 65.59±18.98 | 64.13±18.09 | 68.48±20.35 | <0.001 |
| CT variables | ||||
| Annulus size of area, mm2 | 412.31±76.97 | 368.21±37.05 | 499.58±58.85 | <0.001 |
| Annulus size of perimeter, mm | 72.84±7.30 | 69.13±4.62 | 80.11±6.02 | <0.001 |
| Procedural variables | ||||
| Transfemoral access | 2,620 (97) | 1,742 (97) | 878 (97) | 0.66 |
| Transapical access | 50 (2) | 30 (2) | 20 (2) | |
| Direct aortic access | 20 (1) | 14 (1) | 6 (1) | |
| Predilatation | 1,042 (38.6) | 641 (35.8) | 401 (44.3) | <0.001 |
| Post-dilatation | 575 (21.3) | 376 (21.0) | 199 (22.0) | 0.590 |
| THV size | <0.001 | |||
| 20 mm | 175 (6) | 175 (10) | 0 (0) | |
| 23 mm | 1,528 (57) | 1,440 (80) | 88 (10) | |
| 26 mm | 829 (31) | 178 (10) | 651 (72) | |
| 29 mm | 167 (6) | 0 (0) | 167 (18) | |
| Values are numbers (%) or mean±SD. Standardised difference for categorical variables and standardised mean difference for continuous variables. AVA: aortic valve area; BMI: body mass index; BSA: body surface area; CABG: coronary artery bypass grafting; COPD: chronic obstructive pulmonary disease; CT: computed tomography; eGFR: estimated glomerular filtration rate; LAA: large aortic annulus; LVEF: left ventricular ejection fraction; mPG: mean pressure gradient; NYHA: New York Heart Association; PG: pressure gradient; SAA: small aortic annulus; SD: standard deviation; THV: transcatheter heart valve | ||||
Postprocedural echocardiographic parameters and procedural outcomes
Postprocedural echocardiographic parameters and procedural variables are presented in Table 2. Both EOA and indexed EOA were significantly smaller in the SAA group than in the LAA group. The postprocedural peak velocity and mPG were higher in the SAA group. The prevalence of an mPG ≥20 mmHg was significantly higher in the SAA group than in the LAA group (8.5% vs 1.8%; p<0.001). The rate of severe PPM was also higher in the SAA group than the LAA group (3.0% vs 1.0%). Except for the rate of PMI (6.9% vs 3.6%; p=0.001), the incidences of procedural complications were similar between the two groups. Important variables are summarised in Supplementary Figure 2.
Table 2. Postprocedural echocardiographic parameters and procedural variables.
| Overall (n=2,699) |
SAA (n=1,794) |
LAA (n=905) |
p-value | |
|---|---|---|---|---|
| Postprocedural echocardiographic variables | ||||
| EOA, cm2 | 1.63±0.44 | 1.51±0.38 | 1.86±0.46 | <0.001 |
| Indexed EOA, cm2/m2 | 1.13±0.29 | 1.09±0.27 | 1.21±0.31 | <0.001 |
| Peak flow velocity, m/sec | 2.38±0.45 | 2.46±0.46 | 2.21±0.39 | <0.001 |
| Peak PG, mmHg | 23.46±10.41 | 25.11±11.25 | 20.19±7.47 | <0.001 |
| mPG, mmHg | 12.22±4.87 | 13.13±4.92 | 10.41±4.23 | <0.001 |
| mPG ≥20 mmHg | 168 (6.2) | 152 (8.5) | 16 (1.8) | <0.001 |
| PVL ≥mild | 654 (24) | 430 (24) | 224 (25) | 0.76 |
| PVL | 0.88 | |||
| None-trivial | 2,028 (75) | 1,355 (76) | 673 (75) | |
| Mild | 625 (23) | 411 (23) | 214 (24) | |
| ≥Moderate | 29 (1) | 19 (1) | 10 (1) | |
| PPM | <0.001 | |||
| None | 2,230 (84) | 1,432 (81) | 798 (90) | |
| Moderate | 377 (14) | 295 (16) | 82 (9) | |
| Severe | 52 (2) | 45 (3) | 7 (1) | |
| Procedural complications (in-hospital) | ||||
| In-hospital death | 27 (1.0) | 16 (0.9) | 11 (1.2) | 0.554 |
| Conversion to open-heart surgery | 13 (0.5) | 11 (0.6) | 2 (0.2) | 0.241 |
| Major stroke | 13 (0.5) | 11 (0.6) | 2 (0.2) | 0.127 |
| ≥Major bleeding | 126 (4.7) | 92 (5.1) | 34 (3.8) | 0.133 |
| Major vascular complication | 96 (3.6) | 65 (3.6) | 31 (3.4) | 0.877 |
| Cardiac tamponade | 22 (0.9) | 15 (1.0) | 6 (0.7) | 0.530 |
| New pacemaker implantation | 157 (5.8) | 124 (6.9) | 33 (3.6) | 0.001 |
| Values are numbers (%) or mean±SD. Standardised difference for categorical variables and standardised mean difference for continuous variables. EOA: effective orifice area; LAA: large aortic annulus; mPG: mean pressure gradient; PG: pressure gradient; PPM: prosthesis-patient mismatch; PVL: paravalvular leakage; SAA: small aortic annulus; SD: standard deviation | ||||
Long-term outcomes
The median follow-up period was 4.8 years (interquartile range 2.4-5.7), with a maximum of 8.8 years after TAVI. At the 5-year mark, the follow-up rate reached 85.7%. A total of 1,139 deaths were observed, with a 7-year cumulative mortality rate of 57.2%, while BVF occurred in 3.2% and BVF-related mortality was 1.2% (Figure 1A). The cumulative all-cause mortality rate at 7 years after TAVI was lower in the SAA group than in the LAA group (55.2% vs 58.6%; p<0.001, log-rank test) (Central illustration). The Cox regression multivariable analysis identified multiple clinical variables associated with an increased risk of late all-cause mortality after TAVI, whereas an SAA was not related to late mortality (HR 1.07, 95% CI: 0.85-1.36; p=0.56) (Table 3). In addition to the analysis comparing small versus large annulus groups, a multivariable analysis was also performed for the CT-derived annulus area (per 1 mm² increase) and annulus perimeter (per 1 mm increase). However, neither an increase in area (per 1 mm²) nor in perimeter (per 1 mm) was associated with long-term mortality risk (HR 1.00, 95% CI: 0.99-1.00; p=0.22; HR 1.00, 95% CI: 0.99-1.02; p=0.69, respectively). An interaction was observed between annulus size and sex (p for interaction=0.03) (Figure 2A). However, when stratified by sex, there was no consistent trend favouring worse outcomes in the SAA group in either the male or female subgroup (Figure 2B-Figure 2C). In both sexes, hazard ratios varied among subpopulations, and no subgroup demonstrated a uniformly poorer prognosis associated with smaller annulus area. The comparison of prognosis between SAA and LAA by sex showed that, in males, those with an SAA tended to have a lower mortality rate (61.8% vs 64.9%; p=0.053), while in females, no significant difference was observed between the groups (44.6% vs 54.0%; p=0.27) (Figure 3A-Figure 3B). Subgroup analysis for mPG ≥20 mmHg and severe PPM showed no significant difference in long-term outcomes between the SAA and LAA groups (Supplementary Figure 3A-Supplementary Figure 3B). Focusing on the SAA group, the incidence of mPG ≥20 mmHg and severe PPM did not reveal any significant difference in terms of mortality (Supplementary Figure 4A-Supplementary Figure 4B). In the Cox univariable analysis, an mPG >20 mmHg was not significant, whereas an increase of 1 mmHg in the mPG suggested a potential reduction in mortality risk. Based on this finding, mPG (per 1 mmHg increase) was included in the multivariable analysis, but it did not reach statistical significance. Severe PPM tended to be associated with increased mortality in the univariable analysis; however, this association was attenuated in the multivariable analysis. Regarding HF risk, Fine-Gray analysis showed a trend towards a higher risk in the SAA group in univariable analysis, but this was not significant in multivariable analysis, where other clinical factors were identified as independent predictors (Supplementary Table 1). 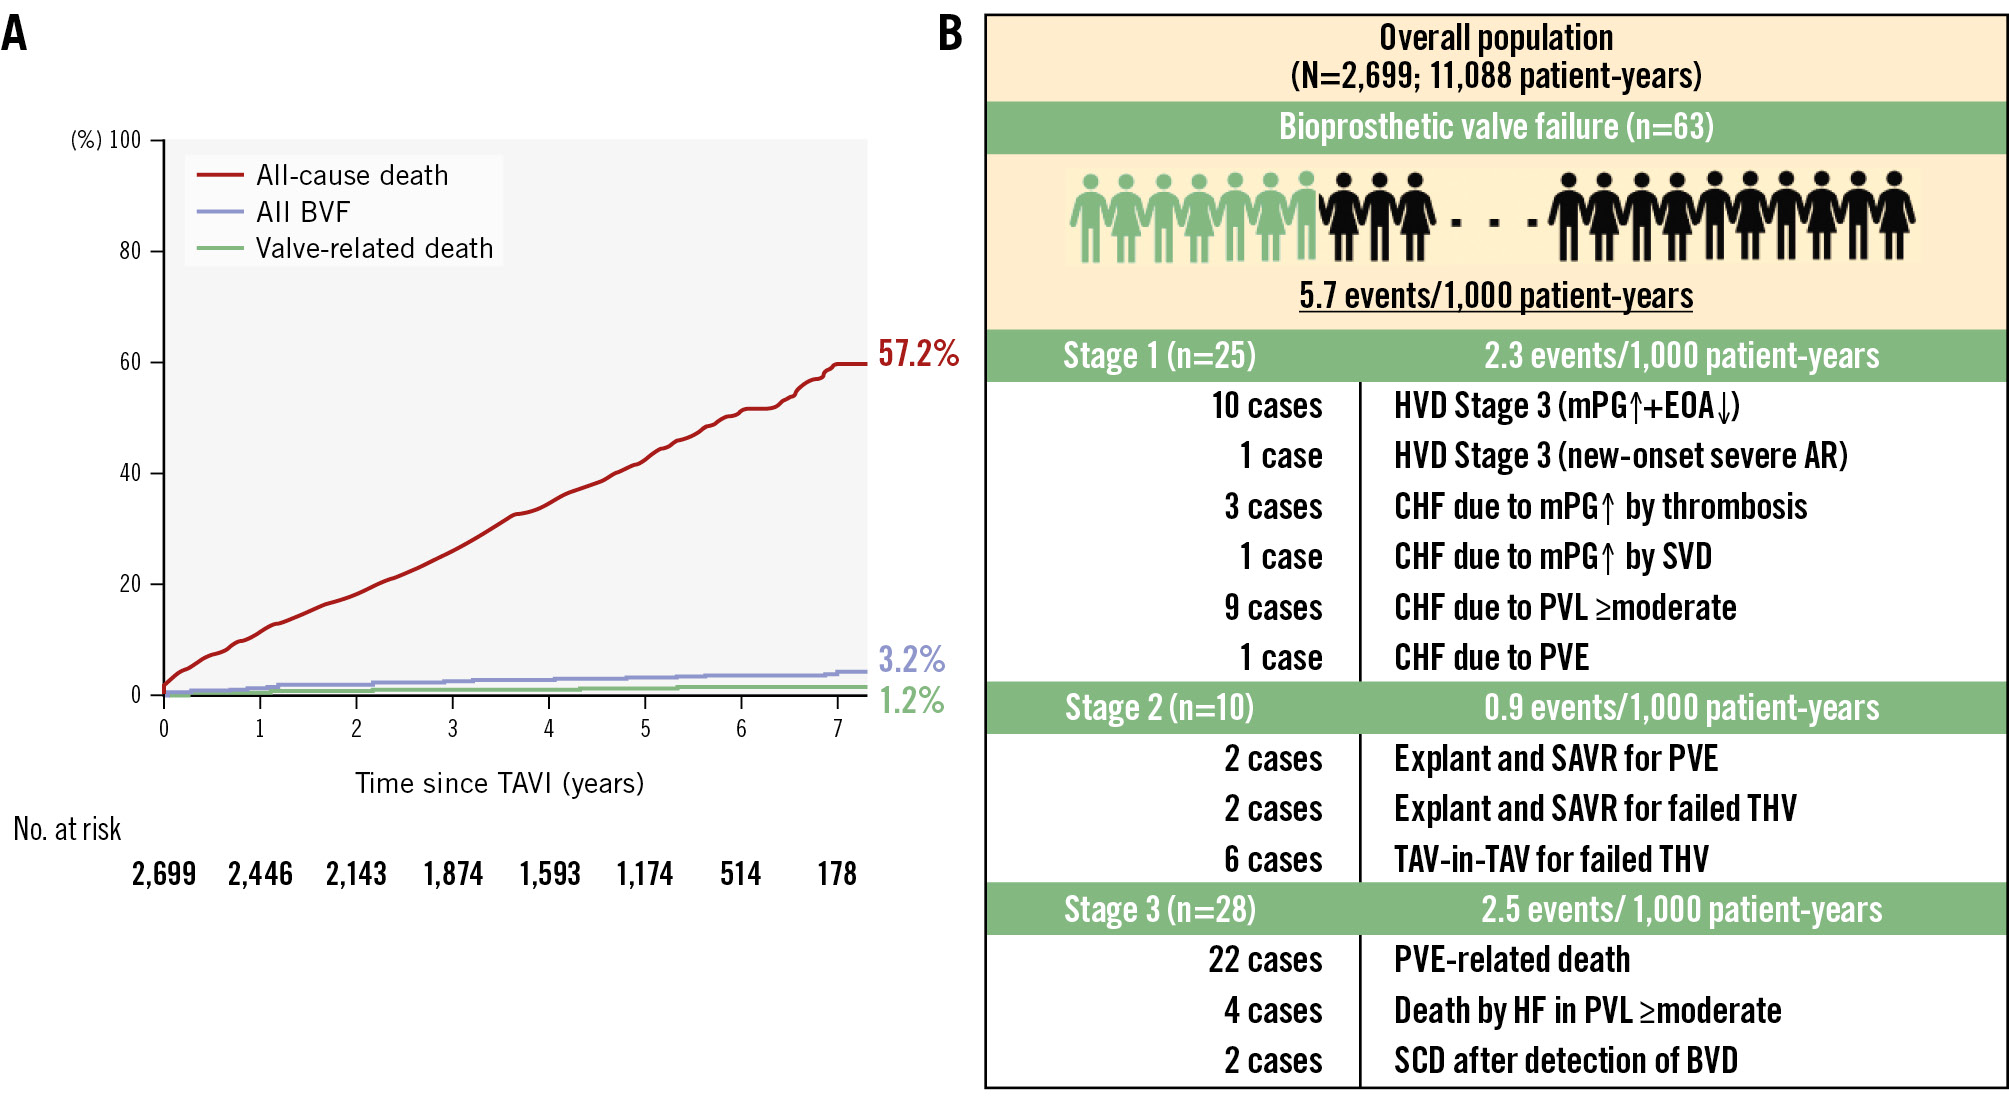
Figure 1. Cumulative incidence of all-cause death, all BVF, and valve-related death in the overall cohort up to 7 years after TAVI. The all-cause mortality rate was 57.2%, all BVF rate was 3.2%, and valve-related death rate was 1.2% (A). The overall BVF events rate was 5.7 events per 1,000 patient-years, with stage-specific rates as follows: Stage 1: 2.3 events, Stage 2: 0.9 events, and Stage 3: 2.5 events per 1,000 patient-years (B). AR: aortic regurgitation; BVD: bioprosthetic valve deterioration; BVF: bioprosthetic valve failure; CHF: congestive heart failure; EOA: effective orifice area; HF: heart failure; HVD: haemodynamic valve deterioration; mPG: mean pressure gradient; PVE: prosthetic valve endocarditis; PVL: paravalvular leakage; SAVR: surgical aortic valve replacement; SCD: sudden cardiac death; SVD: structural valve deterioration; TAV: transcatheter aortic valve; TAVI: transcatheter aortic valve implantation; THV: transcatheter heart valve
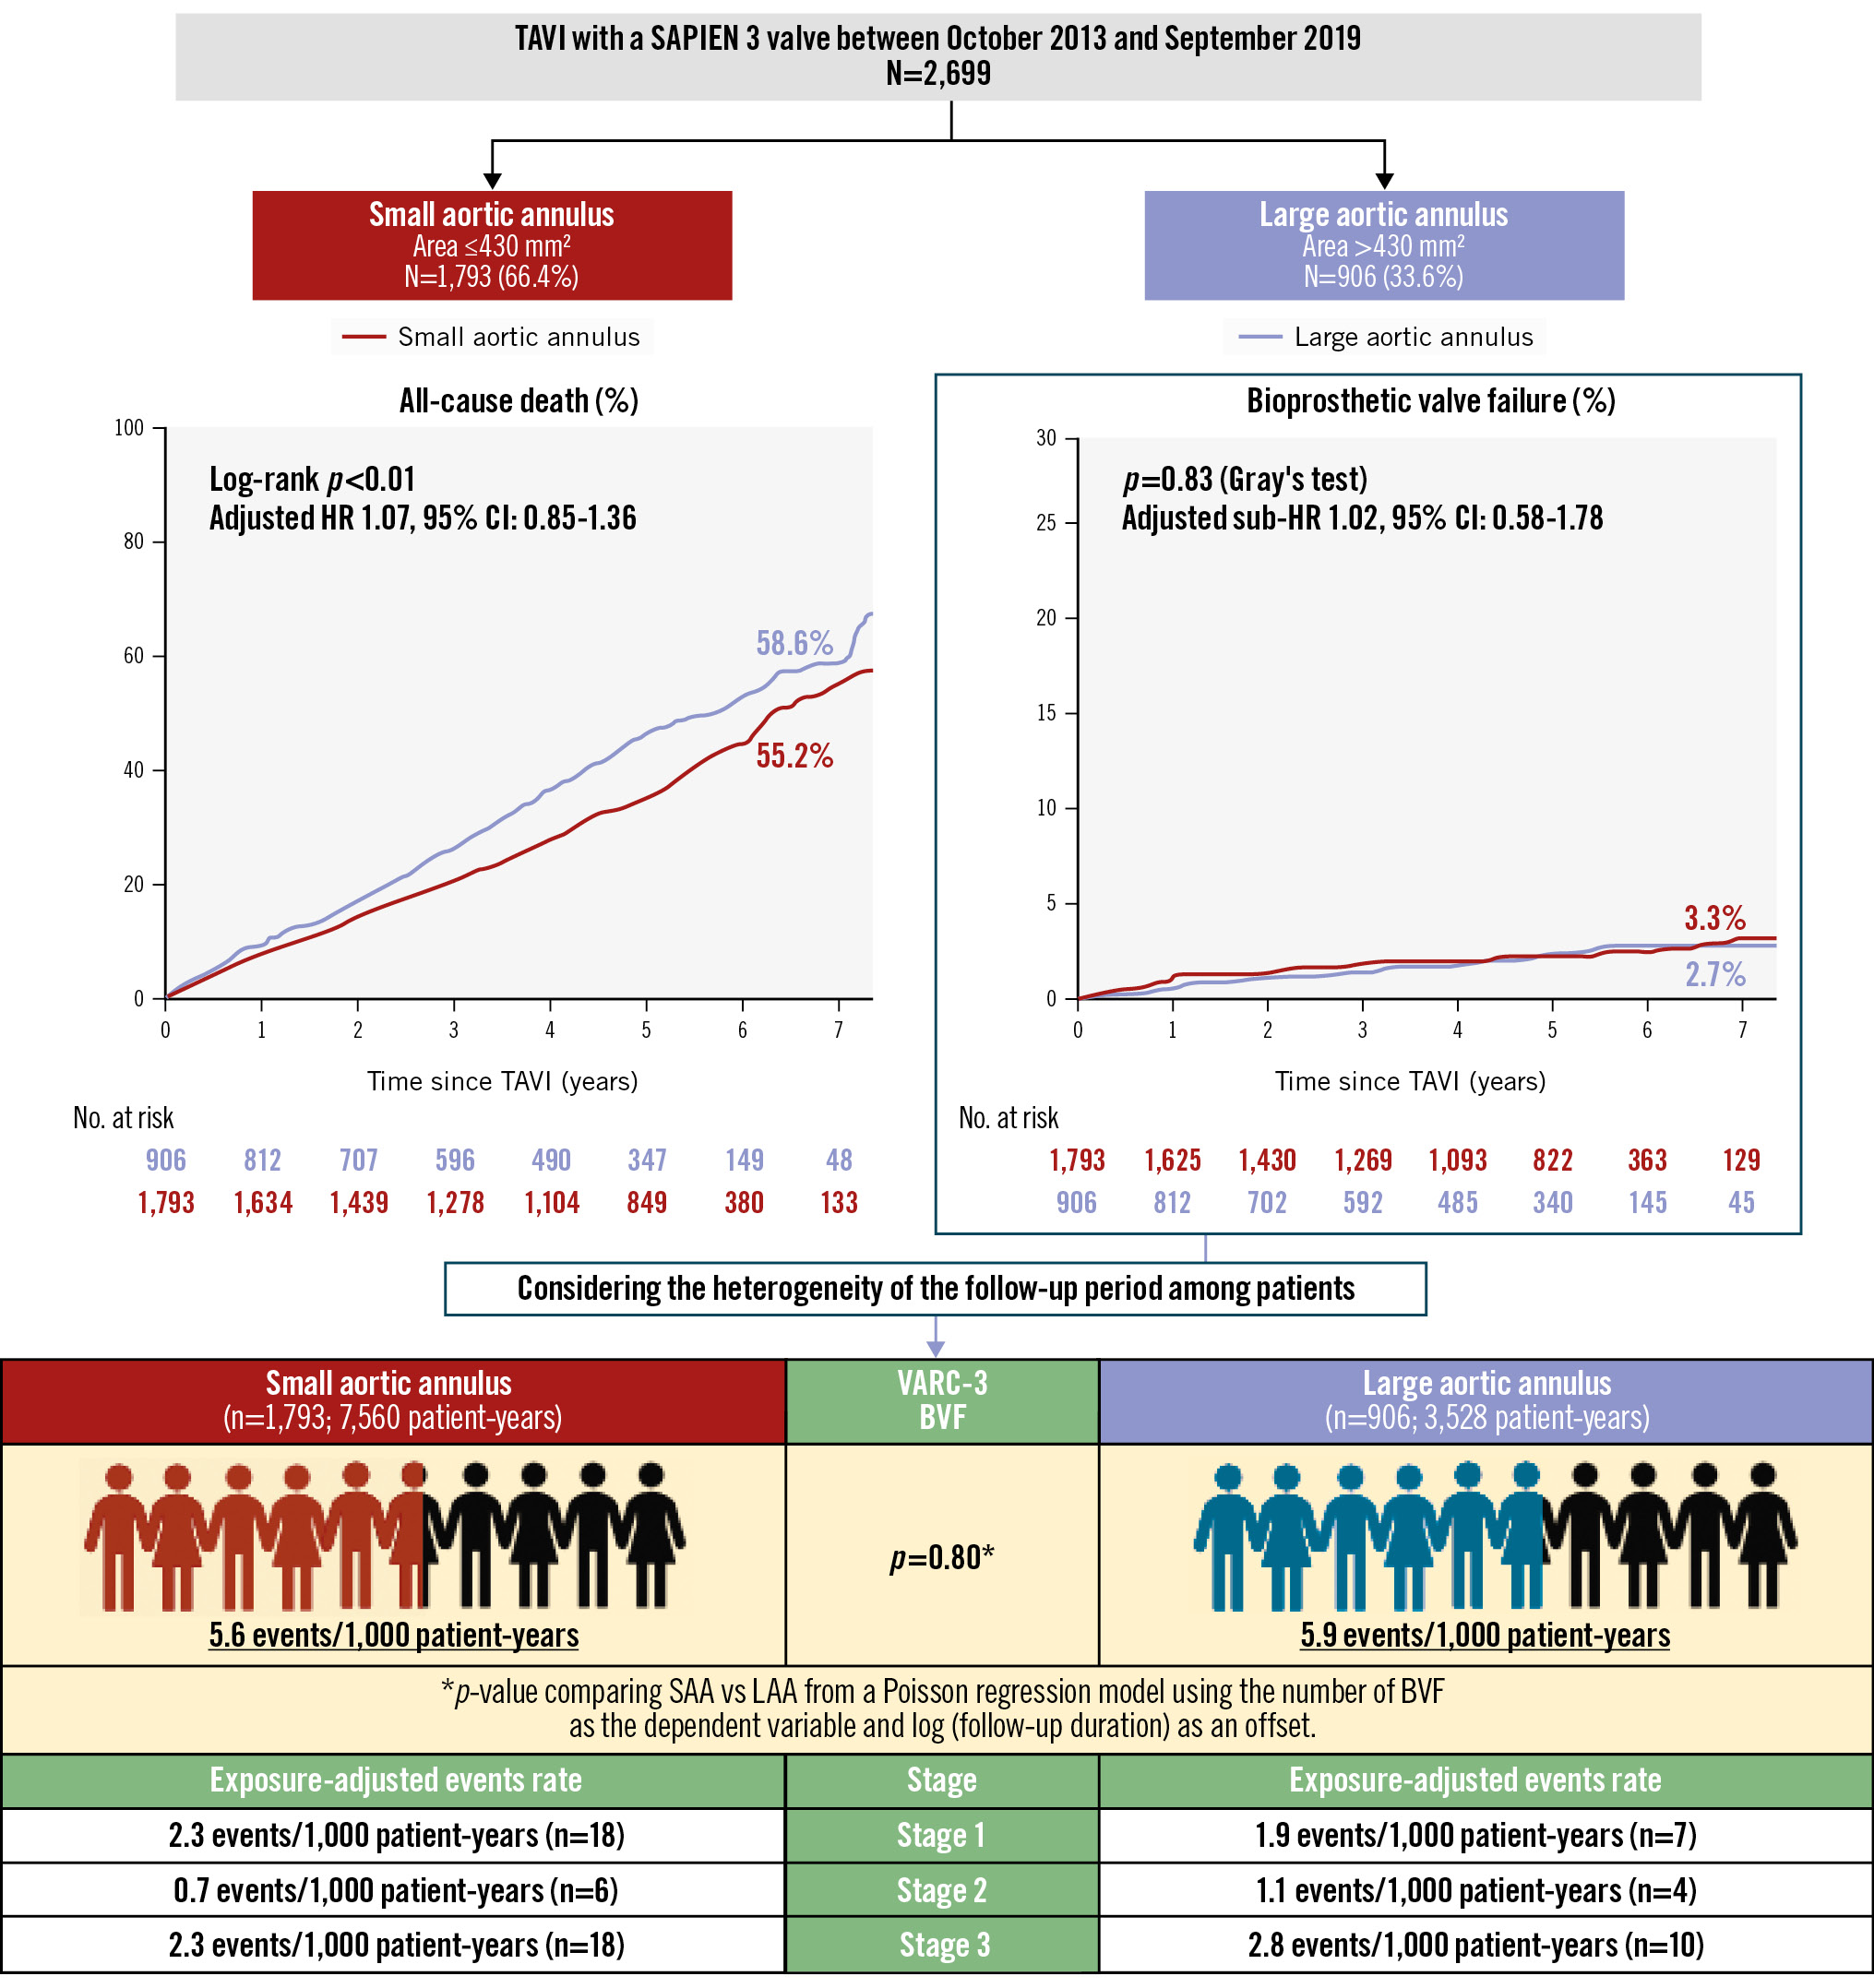
Central illustration. Long-term outcomes and durability of a balloon-expandable transcatheter heart valve in small and large annuli. Among 2,699 patients who underwent TAVI with a BE-THV, patients with an SAA (n=1,793) had a lower 7-year mortality rate compared to patients with an LAA (n=906). Whilst the mortality rate among patients with an SAA was lower than that of those with an LAA, the adjusted hazard ratio was 1.07 with a 95% confidence interval of 0.85 to 1.36, indicating no statistically significant difference. Gray’s test also showed no difference in BVF between the SAA and LAA groups. Similarly, the incidence of BVF assessed by the person-year method did not differ significantly between the two groups. BE-THV: balloon-expandable transcatheter heart valve; BVF: bioprosthetic valve failure; CI: confidence interval; HR: hazard ratio; LAA: large aortic annulus; SAA: small aortic annulus; TAVI: transcatheter aortic valve implantation; VARC: Valve Academic Research Consortium
Table 3. The Cox regression multivariable analysis for the association of all-cause mortality and clinical findings.
| Univariable analysis | Multivariable analysis Model 1 | Multivariable analysis Model 2 | Multivariable analysis Model 3 | |||||||||
|---|---|---|---|---|---|---|---|---|---|---|---|---|
| Clinical variables | HR | 95% CI | p-value | HR | 95% CI | p-value | HR | 95% CI | p-value | HR | 95% CI | p-value |
| CT-measured aortic annulus size | ||||||||||||
| SAA (compared to LAA) | 0.77 | 0.68-0.87 | <0.001 | 1.07 | 0.85-1.36 | 0.561 | ||||||
| Aortic annulus area (per 1.0 mm2 increase) | 1.00 | 1.00-1.00 | <0.001 | 1.00 | 0.99-1.003 | 0.223 | ||||||
| Aortic annulus perimeter (per 1.0 mm increase) | 1.02 | 1.01-1.03 | <0.001 | 1.00 | 0.99-1.02 | 0.693 | ||||||
| Patient background | ||||||||||||
| Age (per 1 year increase) | 1.04 | 1.03-1.05 | <0.001 | 1.02 | 1.00-1.04 | 0.023 | 1.02 | 1.00-1.04 | 0.016 | 1.02 | 1.00-1.04 | 0.018 |
| Male (compared to female) | 1.54 | 1.37-1.73 | <0.001 | 1.82 | 1.49-2.24 | <0.001 | 1.72 | 1.40-2.12 | <0.001 | 1.76 | 1.43-2.17 | <0.001 |
| BSA* (per 1.0 m2 increase) | 0.54 | 0.38-0.77 | 0.001 | |||||||||
| BMI (per 1.0 kg/m2 increase) | 0.92 | 0.91-0.94 | <0.001 | 0.94 | 0.92-0.96 | <0.001 | 0.94 | 0.92-0.96 | <0.001 | 0.94 | 0.92-0.97 | <0.001 |
| Hypertension | 0.90 | 0.77-1.05 | 0.189 | |||||||||
| Diabetes mellitus | 1.11 | 0.98-1.25 | 0.115 | |||||||||
| Chronic kidney disease* | 1.15 | 1.01-1.31 | 0.04 | |||||||||
| Atrial fibrillation/flutter | 1.37 | 1.20-1.57 | <0.001 | 1.01 | 0.85-1.21 | 0.877 | 1.02 | 0.85-1.21 | 0.865 | 1.03 | 0.86-1.23 | 0.787 |
| Coronary artery disease | 1.20 | 1.06-1.35 | 0.003 | 0.95 | 0.79-1.13 | 0.557 | 0.95 | 0.80-1.13 | 0.570 | 0.96 | 0.80-1.14 | 0.615 |
| Previous CABG | 0.72 | 0.44-1.18 | 0.195 | |||||||||
| Previous cardiac surgery | 1.30 | 1.02-1.64 | 0.031 | 1.15 | 0.87-1.52 | 0.317 | 1.16 | 0.88-1.53 | 0.288 | 1.10 | 0.82-1.46 | 0.538 |
| Peripheral artery disease | 1.51 | 1.27-1.80 | <0.001 | 1.06 | 0.84-1.21 | 0.645 | 1.06 | 0.84-1.34 | 0.608 | 1.08 | 0.86-1.37 | 0.503 |
| Previous stroke | 1.34 | 1.13-1.60 | 0.001 | 1.17 | 0.94-1.46 | 0.161 | 1.18 | 0.95-1.47 | 0.139 | 1.17 | 0.94-1.47 | 0.163 |
| Pulmonary disease | 1.68 | 1.46-1.94 | <0.001 | 1.69 | 1.37-2.08 | <0.001 | 1.71 | 1.39-2.10 | <0.001 | 1.72 | 1.40-2.13 | <0.001 |
| NYHA Class III/IV (compared to Class II) | 1.74 | 1.55-1.95 | <0.001 | 1.25 | 1.06-1.48 | 0.01 | 1.25 | 1.05-1.48 | 0.010 | 1.22 | 1.02-1.45 | 0.026 |
| Clinical Frailty Scale (per 1 scale increase) | 1.27 | 1.22-1.33 | <0.001 | 1.17 | 1.09-1.24 | <0.001 | 1.16 | 1.09-1.24 | <0.001 | 1.16 | 1.08-1.24 | <0.001 |
| Laboratory data | ||||||||||||
| Albumin (per 1.0 g/dL increase) | 0.41 | 0.37-0.46 | <0.001 | 0.67 | 0.56-0.79 | <0.001 | 0.67 | 0.56-0.80 | <0.001 | 0.66 | 0.56-0.79 | <0.001 |
| eGFR (per 1.0 mL/dL/1.73 m2 increase) | 0.99 | 0.99-0.99 | <0.001 | 0.99 | 0.99-1.00 | 0.001 | 0.99 | 0.99-1.00 | 0.001 | 0.99 | 0.99-1.00 | 0.002 |
| Haemoglobin (per 1.0 g/dL increase) | 0.84 | 0.81-0.87 | <0.001 | 0.91 | 0.86-0.96 | 0.001 | 0.91 | 0.86-0.97 | 0.001 | 0.91 | 0.86-0.96 | 0.001 |
| Echocardiographic findings | ||||||||||||
| LVEF (per 1.0% increase) | 0.98 | 0.98-0.99 | <0.001 | 1.00 | 0.99-1.01 | 0.975 | 1.00 | 0.99-1.01 | 0.806 | 1.00 | 0.99-1.01 | 0.985 |
| Preprocedural mPG* (per 1.0 mmHg increase) | 0.99 | 0.99-1.00 | <0.001 | |||||||||
| Preprocedural mPG <40 mmHg | 1.28 | 1.14-1.45 | <0.001 | 1.24 | 1.05-1.46 | 0.011 | 1.26 | 1.07-1.49 | 0.007 | 1.26 | 1.06-1.49 | 0.009 |
| Preprocedural AR ≥moderate | 1.05 | 0.87-1.26 | 0.645 | |||||||||
| Preprocedural MR ≥moderate | 1.36 | 1.16-1.60 | <0.001 | 1.07 | 0.86-1.33 | 0.554 | 1.06 | 0.86-1.32 | 0.584 | 1.09 | 0.87-1.35 | 0.468 |
| Preprocedural TR ≥moderate | 1.64 | 1.37-1.96 | <0.001 | 1.06 | 0.83-1.35 | 0.635 | 1.07 | 0.84-1.36 | 0.590 | 1.02 | 0.79-1.31 | 0.884 |
| Postprocedural EOA (per 1.0 cm2 increase) | 1.02 | 0.89-1.17 | 0.741 | |||||||||
| Postprocedural indexed EOA* (per 1.0 cm2/m2 increase) | 1.21 | 0.99-1.47 | 0.06 | |||||||||
| Postprocedural mPG (per 1.0 mmHg increase) | 0.97 | 0.96-0.98 | <0.001 | 0.99 | 0.97-1.01 | 0.146 | 0.99 | 0.97-1.01 | 0.153 | 0.98 | 0.96-1.00 | 0.093 |
| Postprocedural mPG ≥20 mmHg | 0.84 | 0.66-1.08 | 0.186 | |||||||||
| Severe PPM | 1.39 | 0.96-2.01 | 0.078 | 1.12 | 0.64-1.95 | 0.688 | 1.11 | 0.64-1.93 | 0.720 | 0.96 | 0.49-1.90 | 0.907 |
| PVL ≥mild | 1.09 | 0.96-1.24 | 0.167 | |||||||||
| TAVI procedural variables | ||||||||||||
| Transfemoral (compared to non-transfemoral) | 0.59 | 0.43-0.81 | 0.001 | 0.81 | 0.51-1.29 | 0.38 | 0.81 | 0.51-1.28 | 0.369 | 0.81 | 0.50-1.29 | 0.367 |
| 20 mm size THV (compared to non-20 mm size THV) | 1.02 | 0.81-1.28 | 0.887 | |||||||||
| THV size (per 1 size increase) | 1.18 | 1.08-1.28 | <0.001 | 1.08 | 0.91-1.28 | 0.408 | 0.96 | 0.78-1.17 | 0.663 | 1.01 | 0.84-1.22 | 0.902 |
| *Variables were not entered in the multivariable model. AR: aortic regurgitation; BMI: body mass index; BSA: body surface area; CABG: coronary artery bypass grafting; CI: confidence interval; CT: computed tomography; eGFR: estimated glomerular filtration rate; EOA: effective orifice area; HR: hazard ratio; LAA: large aortic annulus; LVEF: left ventricular ejection fraction; mPG: mean pressure gradient; MR: mitral regurgitation; NYHA: New York Heart Association; PPM: prosthesis-patient mismatch; PVL: paravalvular leakage; SAA: small aortic annulus; TAVI: transcatheter aortic valve implantation; THV: transcatheter heart valve; TR: tricuspid regurgitation | ||||||||||||
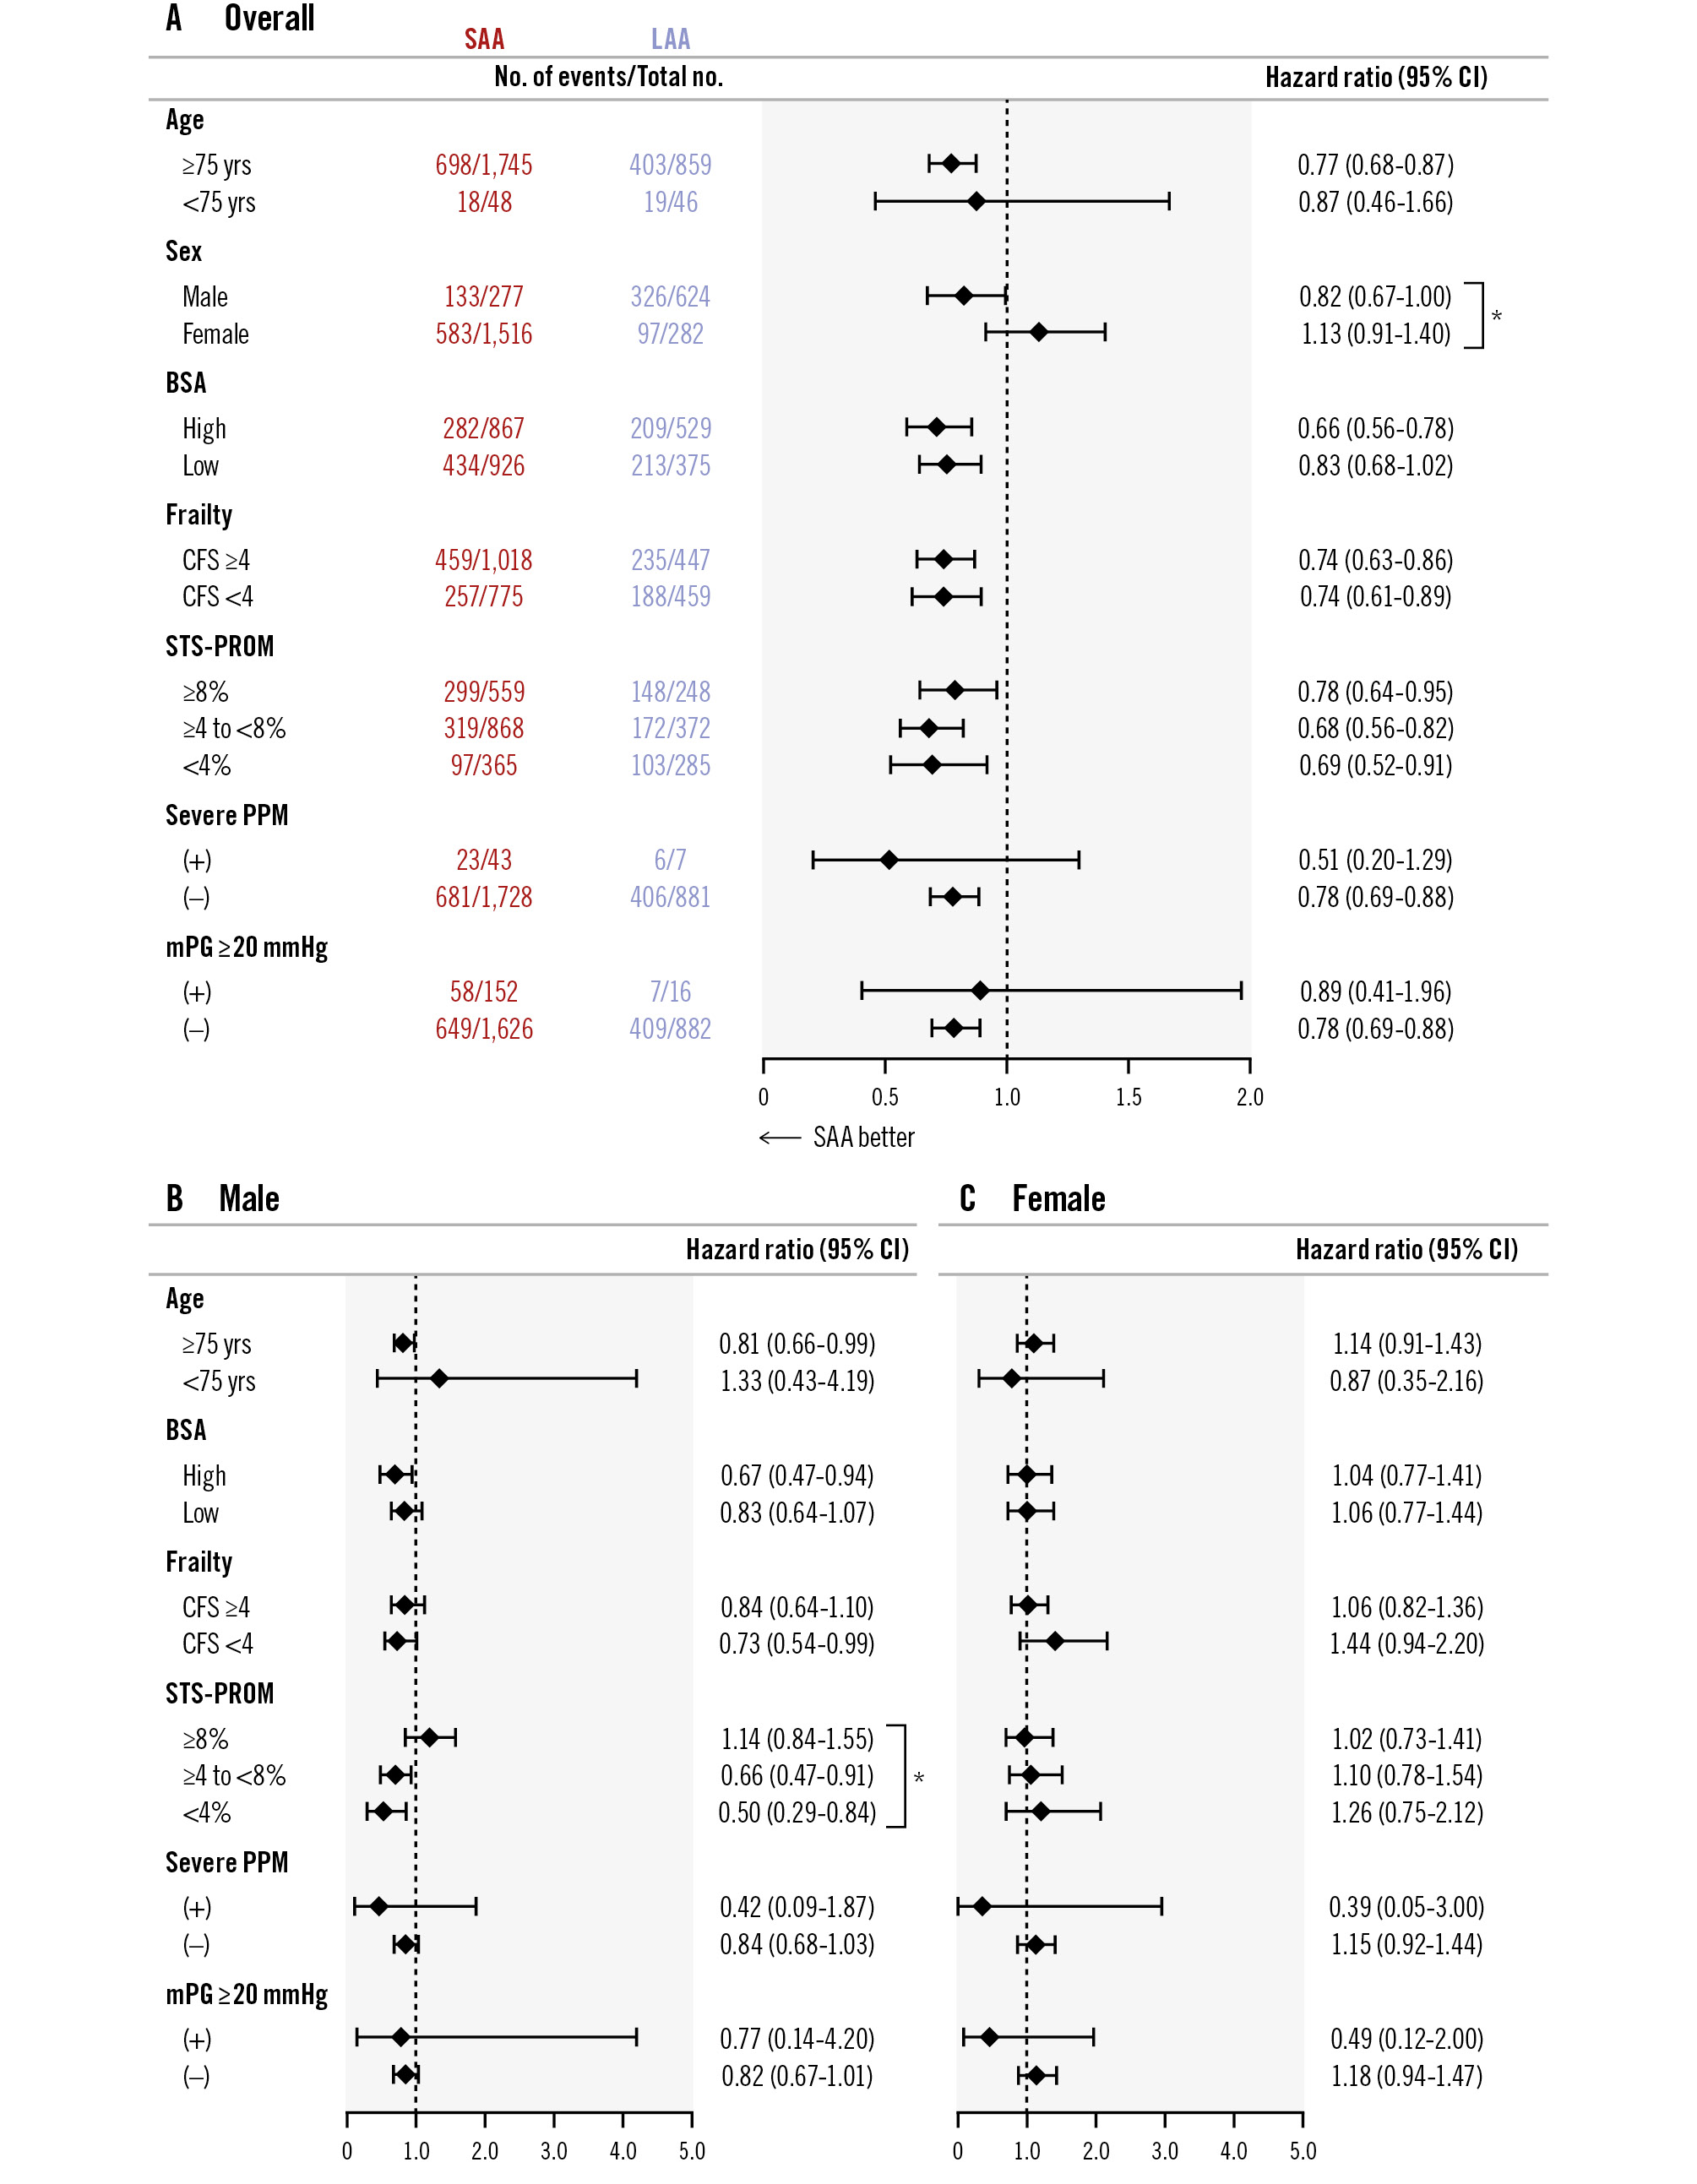
Figure 2. Subgroup analysis of the association between annular size and all-cause mortality. Overall cohort (A), male patients (B), female patients (C). BSA: body surface area; CFS: Clinical Frailty Scale; CI: confidence interval; LAA: large aortic annulus; mPG: mean pressure gradient; PPM: prosthesis-patient mismatch; SAA: small aortic annulus; STS-PROM: Society of Thoracic Surgeons Predicted Risk of Mortality
The incidence of BVF
The results of the Fine-Gray competing risk regression analysis to predict the association between patient characteristics and BVF are presented in Table 4. The presence of SAA, CT-derived annulus area (per 1 mm² increase), and annulus perimeter (per 1 mm increase) were not associated with increased risk of BVF after TAVI. In addition, the presence of an mPG ≥20 mmHg and severe PPM were not found to be risk factors of BVF. According to the VARC-3 criteria, the overall incidence rate of BVF was 5.7 events per 1,000 patient-years (n=63) during a total follow-up period of 11,088 patient-years (Figure 1B). Among the 63 BVF cases, Stage 1 BVF occurred at 2.3 events per 1,000 patient-years (n=25), Stage 2 BVF at 0.9 events per 1,000 patient-years (n=10), and Stage 3 BVF at 2.5 events per 1,000 patient-years (n=28). Regarding the relationship between annular size and BVF, patients with SAA and LAA had nearly identical incidence rates of BVF (5.6 vs 5.9 events per 1,000 patient-years; p=0.80), and Gray’s test also showed no significant difference in the cumulative incidence of BVF between the groups (3.3% vs 2.7%; p=0.83) (Central illustration). The frequency of BVF between SAA and LAA was examined by sex. In males, there was no significant difference (2.6% vs 3.6%; p=0.37), and in females, no significant difference was found either (4.1% vs 1.6%; p=0.14) (Figure 3C-Figure 3D). Subgroup analysis of mPG ≥20 mmHg and severe PPM demonstrated no significant differences in the incidences of BVF between groups, irrespective of their presence (Supplementary Figure 3C-Supplementary Figure 3D). Similarly, within the SAA group, neither mPG ≥20 mmHg nor severe PPM was associated with a significant difference in BVF incidences (Supplementary Figure 4C-Supplementary Figure 4D).
Table 4. The Fine-Gray competing risk regression analysis for predicting BVF.
| Univariable analysis | |||
|---|---|---|---|
| Clinical variables | HR | 95% CI | p-value |
| CT-measured aortic annulus size | |||
| SAA (compared to LAA) | 0.96 | 0.57-1.60 | 0.86 |
| Aortic annulus area (per 1.0 mm2 increase) | 0.99 | 0.99-1.00 | 0.72 |
| Aortic annulus perimeter (per 1.0 mm increase) | 0.99 | 0.99-1.00 | 0.98 |
| Patient background | |||
| Age (per 1 year increase) | 0.97 | 0.92-1.01 | 0.14 |
| Male (compared to female) | 1.12 | 0.67-1.86 | 0.67 |
| BSA (per 1.0 m2 increase) | 2.87 | 0.70-11.8 | 0.14 |
| BMI (per 1.0 kg/m2 increase) | 1.01 | 0.94-1.08 | 0.76 |
| Hypertension | 0.90 | 0.77-1.05 | 0.19 |
| Diabetes mellitus | 1.05 | 0.80-1.38 | 0.71 |
| Chronic kidney disease | 1.18 | 0.68-2.05 | 0.56 |
| Atrial fibrillation | 1.65 | 0.98-2.77 | 0.058 |
| Coronary artery disease | 0.83 | 0.49-1.42 | 0.50 |
| Previous CABG | 0.12 | 0.01-1.14 | 0.065 |
| Laboratory data | |||
| Albumin (per 1.0 g/dL increase) | 1.11 | 0.69-1.77 | 0.68 |
| eGFR (per 1.0 mL/dL/1.73 m2 increase) | 0.99 | 0.98-1.01 | 0.51 |
| Haemoglobin (per 1.0 g/dL increase) | 1.01 | 0.86-1.18 | 0.93 |
| Echocardiographic findings | |||
| LVEF (per 1.0% increase) | 1.02 | 0.99-1.04 | 0.10 |
| Postprocedural mPG ≥20 mmHg | 1.56 | 0.67-3.64 | 0.30 |
| Severe PPM | 1.60 | 0.39-6.49 | 0.51 |
| PVL ≥mild | 1.33 | 0.78-2.27 | 0.29 |
| TAVI procedural variables | |||
| Transfemoral (compared to non-transfemoral) | 1.76 | 0.24-12.72 | 0.57 |
| 20 mm size THV (compared to non-20 mm size THV) | 1.48 | 0.64-3.43 | 0.36 |
| THV size (per 1 size increase) | 0.93 | 0.74-1.16 | 0.53 |
| BMI: body mass index; BSA: body surface area; BVF: bioprosthetic valve failure; CABG: coronary artery bypass grafting; CI: confidence interval; CT: computed tomography; eGFR: estimated glomerular filtration rate; HR: hazard ratio; LAA: large aortic annulus; LVEF: left ventricular ejection fraction; mPG: mean pressure gradient; PPM: prosthesis-patient mismatch; PVL: paravalvular leakage; SAA: small aortic annulus; TAVI: transcatheter aortic valve implantation | |||
Figure 3. The rates of all-cause mortality and BVF between SAA and LAA, focused on differences between sexes. The Kaplan-Meier curve showed no statistically significant differences in the rate of all-cause death between SAA and LAA in either males or females (A, B). Adjusted hazard ratios were derived from a Cox regression model adjusted for SAA, age, body mass index, frailty, New York Heart Association Class III/IV, albumin, haemoglobin, baseline mPG, left ventricular ejection fraction, transfemoral approach, valve size, and postprocedural mPG ≥20 mmHg. Similarly, Gray’s test indicated that an SAA had no significant impact on BVF compared to an LAA in males or females (C, D). BVF: bioprosthetic valve failure; CI: confidence interval; HR: hazard ratio; LAA: large aortic annulus; mPG: mean pressure gradient; SAA: small aortic annulus
Discussion
The main findings of this study are summarised as follows: (1) after TAVI with a BE-THV, the 7-year mortality rate was 57.2%, the incidence of BVF was 3.2%, and BVF-related death was observed in 1.2%. In addition to the appearance of structural valve deterioration (SVD), and the new onset of AR, the involvement of PVE was confirmed in one-third of the BVF cases. 2) In TAVI using a BE-THV, multivariable analysis showed no significant differences between the SAA and LAA groups in terms of HF events or all-cause mortality. Additionally, the incidence of BVF did not differ between the groups based on the person-year method (5.6 events/1,000 patient-years vs 5.9 events/1,000 patient-years; p=0.80) or Gray’s test (3.3% vs 2.7%; p=0.83). 3) The SAA group had a higher incidence of severe PPM and mPG ≥20 mmHg after TAVI compared to the LAA group. However, these factors were not identified as predictive factors of late prognosis or BVF in the entire cohort. Even when focusing on the data separately by sex, a lack of association was consistently observed between the sex difference and long-term outcomes, HF hospitalisation, and BVF. As TAVI indications continue to expand, one of the key remaining challenges is clarifying long-term durability of THVs, including SVD. The absence of sufficient durability data has led to different age-based guidelines worldwide. In Europe, the cutoff age for TAVI and surgical aortic valve replacement (SAVR) candidates is clearly set at 75 years, while in Japan, the 75-80 age range is considered a grey zone1112. The United States has adopted a broader approach, defining the entire 65-80 age range as a grey zone for considering both TAVI and SAVR indications13. In the context of lifetime management for AS patients, it is crucial to consider differences in life expectancy across racial groups. Japanese individuals, who are known for their longevity, have notably higher life expectancies. According to Japan’s national census, an 85-year-old male typically has around 6 more years to live, while a female of the same age has about 8 years. In this study cohort, males with an average age of 83.8 years had a 7-year cumulative mortality rate of 64.2%, while females with an average age of 84.7 years had a rate of 52.7%. Although these patients received TAVI, their survival was markedly worse than that of the general population. These results highlight that even in Japan, where life expectancy is among the longest in the world, the poor long-term outcomes support the appropriateness of the current age thresholds for TAVI set by different countries. Although THV durability remains a key issue, the fact that BVF-related mortality is approximately 1% suggests that a broader perspective is needed to identify more effective strategies for improving long-term outcomes in elderly AS patients. Recent discussions have increasingly focused on the variation in THV postoperative haemodynamics, as evaluated by echocardiography, based on a patient’s aortic annulus size. In patients following SAVR, previous studies have reported that an SAA is associated with inferior outcomes, haemodynamic limitations, and an elevated risk of PPM1415. In fact, in this study, an increase in mPG, an mPG ≥20 mmHg, and severe PPM were all more prevalent in the SAA group compared to the LAA group. It is evident that a larger annulus size facilitates the implantation of a bigger THV, which results in favourable postoperative haemodynamic outcomes. Numerous studies, transcending racial differences in body sizes, have shown that patients with SAA tend to have an elevated mPG and a higher frequency of PPM after TAVI using BE-THVs compared to those using SE-THVs3456. However, the prognostic implications of these findings regarding annulus size differences, as well as mPG elevation and PPM, are still controversial and remain under debate1617181920. In this study, the proportion of females in the SAA group was 84.6%, while the proportion of females in the LAA group decreased to 31.1%. A key aspect in the discussion of annular size is the consideration of the patient’s body size, and therefore, an additional analysis was conducted to investigate sex differences separately. Indeed, there was a significant interaction between sex and SAA-LAA status in relation to long-term prognosis. Nevertheless, differences in annulus size did not show any impact on long-term prognosis or BVF in both the male and female groups. Particularly in patients receiving a BE-THV, the mPG elevation showed no correlation with prognosis21. Moreover, the prognosis for those implanted with the exceptionally small 20 mm bioprosthetic valve was similar to that for other larger valve sizes, as reported in both Japan and Western countries2223. The finding of prior evidence, including the recent subanalysis of the RCTs, demonstrated comparable 5-year clinical outcomes between patients with SAA and LAA treated with BE-THVs8. Together, these results suggest that with appropriate valve sizing and implantation strategies, a smaller annulus size does not inherently confer worse long-term outcomes. In line with this, our study also found no significant association between annular size and the risk of subsequent HF. The current study further supports this notion in a real-world cohort with contemporary devices and diverse patient backgrounds. On the contrary, the findings of this study show that severe PPM tends to worsen prognosis. Additionally, the large-scale OCEAN-TAVI study, which included over 7,000 patients and examined all THV types, reported that severe PPM may be associated with poor prognosis24. Given the smaller sample size in our cohort compared to previous OCEAN-TAVI data, it is possible that the current study is underpowered to detect the prognostic significance of severe PPM. Therefore, the influence of severe PPM on long-term outcomes remains an important issue that warrants further investigation in larger cohorts. In this study, BVF was strictly evaluated according to the VARC-3 definition. However, the Fine-Gray competing risk regression analysis did not identify significant risk factors of BVF. This may be due to an insufficient number of BVF events in our cohort. Recent national registry data have reported that factors such as age, mPG >20 mmHg, and postprocedural AR ≥grade 2, etc., were associated with an increased risk of reintervention after TAVI25. Given this context, the number of cases with severe PPM or an mPG ≥20 mmHg in our study was relatively low, making it difficult to determine whether these factors are truly unrelated to BVF. Therefore, a larger cohort is needed to further evaluate these associations. However, a unique feature of the OCEAN-TAVI registry is that patients treated at a given institution tend to receive follow-up care and consultations there as well. Since 2023, TAV-in-TAV for BVF has been approved in Japan, and nearly all patients have undergone TAV-in-TAV procedures at the same institution where they were initially treated. The 0.9 events/1,000 patient-years for THV explants and TAV-in-TAV reinterventions performed up to the 7-year mark can be considered a favourable outcome. Another important point to note is the fact that more than one-third of BVF cases were associated with PVE (n=24) as the underlying cause. Among these, 22 patients died as a result of PVE-related complications. Moreover, 13 cases of PVE were found that did not lead to BVF and were treated successfully with antibiotics (data not shown). The high in-hospital mortality rate following THV explant due to PVE emphasises the necessity of early diagnosis and appropriate preventive approaches26. As TAVI patients are mostly elderly, it is essential to emphasise the importance of infection prevention, including oral care, through patient education and information exchange among healthcare providers.
Limitations
This study is based on registry data and has a retrospective design, which inherently introduces selection bias. Additionally, events were self-reported by each institution, leading to the possibility of underreporting. Regarding follow-up data, survival follow-up beyond 5 years was achieved in over 85% of patients; however, echocardiographic data were available for only approximately 70% of these cases. This is a limitation of registry-based studies, and the presence of missing data may affect the stability of the results. The slightly higher use of 26 mm valves in the SAA group likely reflects real-world practice, where operators have some discretion in borderline annulus cases. Unlike strictly controlled RCTs, such variation is common in daily clinical settings and had a minimal impact on our overall findings. This study does not address early-stage valve deterioration, due to inconsistent echocardiographic follow-up and variability in measurements, which limited reliable classification. As a result, we restricted our analysis to more robust clinical endpoints such as BVF. Long-term prognostic risk factors were properly identified, while the study could not determine specific predictive factors for BVF. BVF can result from various causes, including structural valve deterioration, AR, and PVE, making its precise prediction challenging. Although the frequency of TAV-in-TAV, THV explant, and BVF in this study was comparable to previous reports, the data were derived from a single-race Asian (Japanese) population. Therefore, the applicability of these findings to Western populations requires further validation. Body size differences between the Japanese and Western populations significantly affect the frequency of severe PPM, which differs considerably in Japanese and Western cohorts. It is also necessary to assess the impact of this difference on long-term prognosis and BVF.
Conclusions
In elderly AS patients, longer survival after TAVI remained poor, while BVF occurred at a low frequency, with only a small proportion of deaths linked to BVF. Although further research is necessary to confirm our findings, neither annular size (regardless of sex) nor echocardiographic parameters of BE-THV haemodynamics were associated with long-term prognosis. Furthermore, these factors showed no significant association with BVF. To improve long-term outcomes following TAVI, a more comprehensive approach to lifetime management for AS patients may be required.
Impact on daily practice
The long-term prognosis of elderly patients treated with a balloon-expandable transcatheter heart valve via transcatheter aortic valve implantation (TAVI) was worse than expected, though the frequency of bioprosthetic valve failure (BVF) was low and within acceptable limits. It was found that factors such as annular size and postoperative haemodynamic parameters, defined by echocardiography, had minimal impact on long-term prognosis and BVF. Moving forward, further research is needed to validate these findings. The focus should be on developing more comprehensive lifetime management strategies for elderly patients with aortic stenosis undergoing TAVI, as well as exploring new indicators that may more accurately predict long-term outcomes and BVF in these patients.
Acknowledgements
The authors thank all OCEAN-TAVI investigators for their participation in this study.
Funding
The OCEAN-TAVI registry is supported by Edwards Lifesciences, Medtronic, Abbott Vascular, Boston Scientific, and Daiichi Sankyo. The sponsors were not involved in the study conduct, data collection, statistical analysis, or manuscript writing.
Conflict of interest statement
M. Yamamoto, S. Shirai, Y. Watanabe, G. Nakazawa, M. Asami, Y. Fuku, and K. Hayashida served as clinical proctors for Edwards Lifesciences, Abbott, and Medtronic. K. Ishizu is a proctor of intracardiac echocardiography for Johnson & Johnson. M. Izumo is a screening proctor for Edwards Lifesciences. F. Yashima and H. Nishina are clinical proctors for Medtronic. T. Naganuma is a clinical proctor for Edwards Lifesciences and Medtronic. Y. Ohno is a clinical proctor for Medtronic and Abbott. T. Shimura is a clinical proctor for Medtronic and Abbott. The other authors have no conflicts of interest relevant to the content of this manuscript to declare.
Supplementary data
To read the full content of this article, please download the PDF.